Java Spring-cloud sleuth
This is an post for ilustrate how works Spring Cloud Sleuth for track request throught several microservices
Concept
Sleuth, it’s api module contains all necessary interfaces to be implemented by a tracer. Spring Cloud Sleuth is able to trace your requests and messages so that you can correlate that communication to corresponding log entries. You can also export the tracing information to an external system to visualize latency. Spring Cloud Sleuth supports OpenZipkin compatible systems directly
Spring Cloud Sleuth borrows Dapper’s terminology.
Span: The basic unit of work. For example, sending an RPC is a new span, as is sending a response to an RPC. Spans also have other data, such as descriptions, timestamped events, key-value annotations (tags), the ID of the span that caused them, and process IDs (normally IP addresses).
Spans can be started and stopped, and they keep track of their timing information. Once you create a span, you must stop it at some point in the future.
Trace: A set of spans forming a tree-like structure. For example, if you run a distributed big-data store, a trace might be formed by a PUT request.
Annotation/Event: Used to record the existence of an event in time.
Conceptually in a typical RPC scenario we mark these events to highlight what kind of an action took place (it doesn’t mean that physically such an event will be set on a span).
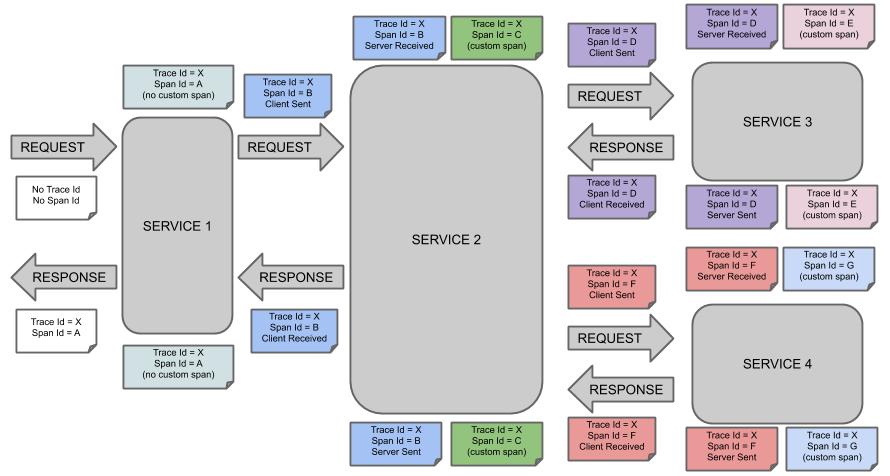
cs: Client Sent. The client has made a request. This annotation indicates the start of the span.
sr: Server Received: The server side got the request and started processing it. Subtracting the cs timestamp from this timestamp reveals the network latency.
ss: Server Sent. Annotated upon completion of request processing (when the response got sent back to the client). Subtracting the sr timestamp from this timestamp reveals the time needed by the server side to process the request.
cr: Client Received. Signifies the end of the span. The client has successfully received the response from the server side. Subtracting the cs timestamp from this timestamp reveals the whole time needed by the client to receive the response from the server.
In the next image you can check the behavior of track ID and span ID between each service and how you could easily identity the same request through the complex microservices structure,
in the case, trace ID is X for just one request and each service adds snap ID for the same request, it’s identify the flow the request on in and back

